Clarifolio vs. a Spreadsheet for Tracking Investments
A spreadsheet is flexible and free; a purpose-built ledger handles cost basis, income types, and reinvestment for you. An honest look at when each one makes sense.
A spreadsheet is where most careful investors start, and for good reason: it's free, private, and does exactly what you tell it. Clarifolio is, in a sense, the spreadsheet many of those investors end up building — with the parts that are easy to get wrong already done.
At a glance
| Spreadsheet | Clarifolio | |
|---|---|---|
| Cost | Free | Free for up to 3 issuers; Pro for unlimited |
| Setup | You design every column and formula | Ready to use |
| Cost basis across several purchases | Your formula, easy to break when you sell part of a position | Weighted average cost, recalculated on every trade |
| Fees and levies | Only if you add columns for them | Brokerage fee and other charges on every trade |
| Dividends, bond interest, T-bill discount | Usually one "income" column | Three income types, each against the holding that paid it |
| Reinvested vs. withdrawn | Rarely tracked | Recorded on every dividend and coupon |
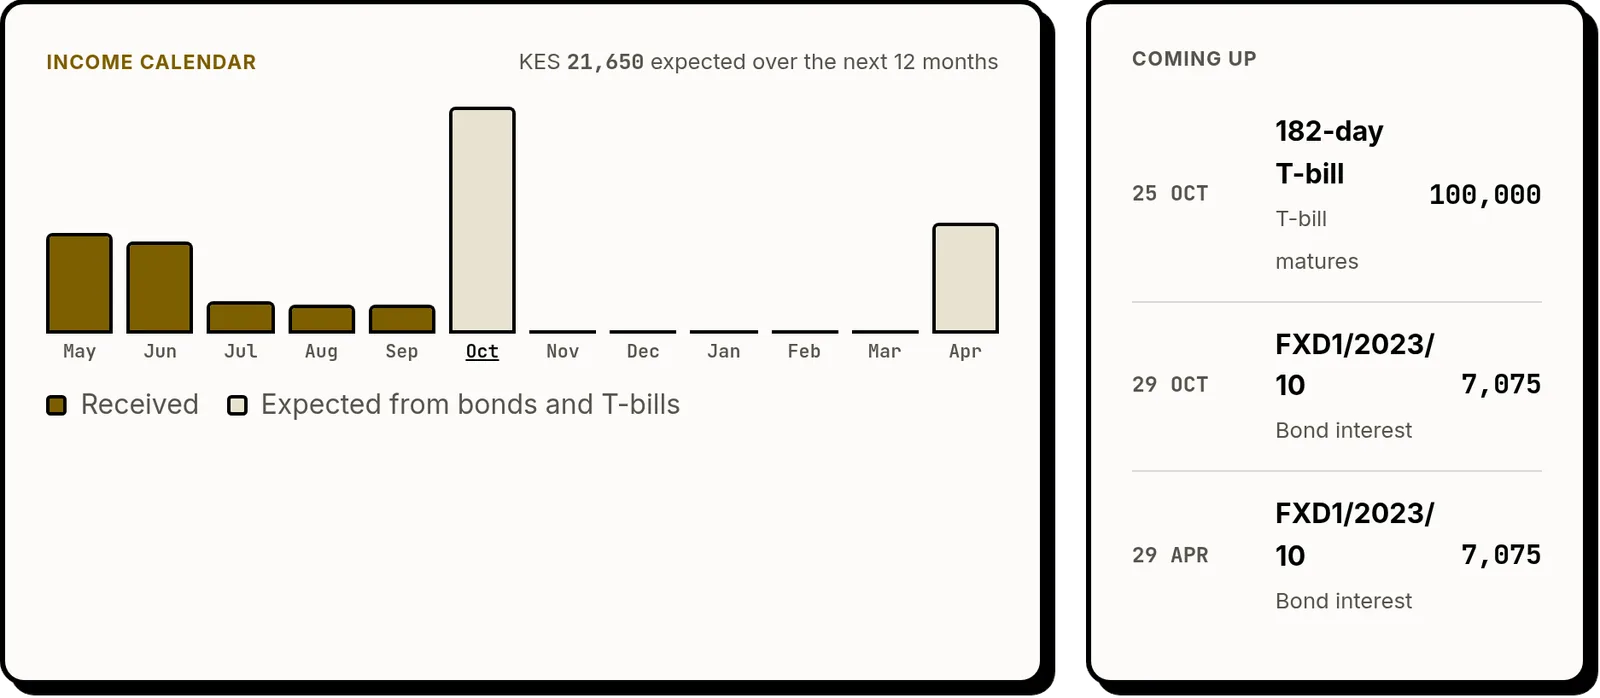
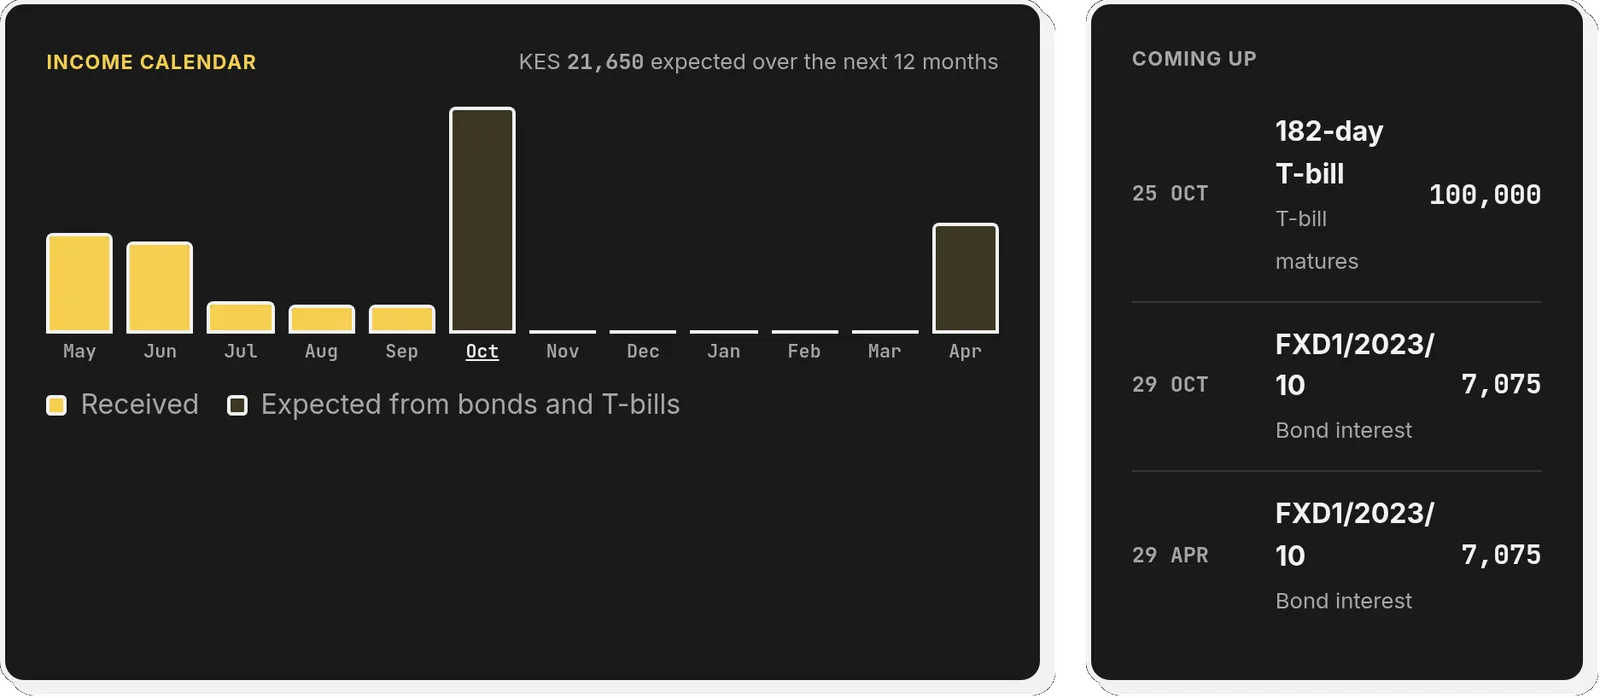
| Bonds and T-bills | Possible, with effort | Tenor, rate, and maturity built in; next maturities shown |
| Year-end summary | Build your own pivot table | Year in Review and a tax-year summary (Pro) |
| Moving your data | — | Import the sheet as Excel or CSV, any column layout |
| Flexibility | Unlimited | Opinionated — built for long-term holdings and income |
| Live prices | Possible with a price function | Not shown, by design |
Where a spreadsheet wins
- Total flexibility. If you want to model something unusual, a spreadsheet will let you.
- It's free at any size.
- You already know how to use it.
Where it quietly goes wrong
The problems with spreadsheets usually aren't visible until they matter:
- Cost basis after a partial sale. Selling part of a position and then buying more is where hand-built formulas most often drift. See weighted average cost basis for what the calculation should do.
- Income mixed together. Dividends, bond coupons, and T-bill discounts behave differently. A single income column makes it hard to see what each part of the portfolio is paying.
- Reinvestment goes unrecorded. Whether a dividend went back into the market or into your current account is one of the most useful things to know at year end, and one of the first things a spreadsheet stops tracking.
- One formula error ripples everywhere, and there's nothing to tell you it happened.
When to stay with your spreadsheet
If you enjoy building it, track something unusual, or need modelling a ledger won't do, keep the spreadsheet. Many people use both: Clarifolio as the record, a spreadsheet for what-if analysis on top of a CSV export.
When to switch
If your spreadsheet has turned into something you maintain rather than something you read — or you've stopped trusting its totals — a ledger built for the job is usually worth it. Start with the free plan and enter your largest holdings first.
Frequently asked questions
Is a spreadsheet good enough to track my investments?
For a small, simple portfolio, often yes. It becomes harder to keep accurate once you have multiple purchases of the same holding, partial sales, several kinds of income, or government securities with maturity dates.
Can I export my Clarifolio data back to a spreadsheet?
Yes. Pro plans include CSV export of your trade history, and every account can download a full copy of its data from account settings.
Does Clarifolio handle partial sales correctly?
Yes. Cost basis uses the weighted average cost of your holding, and realized gains on a sale are calculated against it automatically.